Key Insights
- ETH accumulation rises as investors buy at the $1,886 level
- Short positioning at record highs, raising the risk of a short squeeze.
At press time, Ethereum price teeters at a critical juncture, poised for a decisive move. Despite enduring a 28% correction this month, signs suggest Ethereum has reached its bottom.
Moving ahead, there is a potential short squeeze on the horizon. Trading at $1922, ETH price has posted an intraday gain of 1.36%. This has boosted its market cap to $231.78 Billion, with a total supply of 120.61 Million.
Signs of bottoming out for Ethereum: Is the Worst Finally Over?
According to Glassnode, the Cost Basis Distribution data shows buyers are acquiring Ethereum at a price range starting from $1866. This is attributed to an increasing supply of 1.6 million to 1.9 million ETH. Buyer activity levels in the market serve as safeguards against market declines.
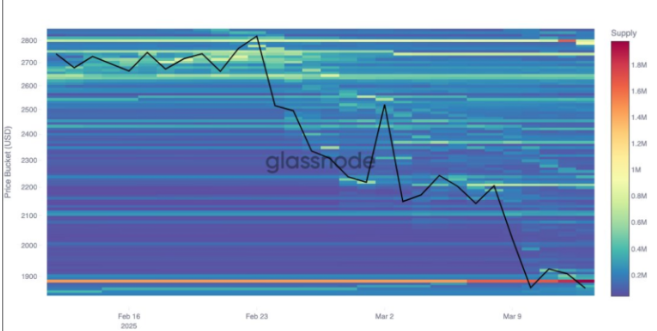
Large amounts of ETH entering into long-term holder portfolios at specific prices turn those levels into essential support zones. ETH investors started accumulating coins despite significant market selling pressure across the Ethereum network.
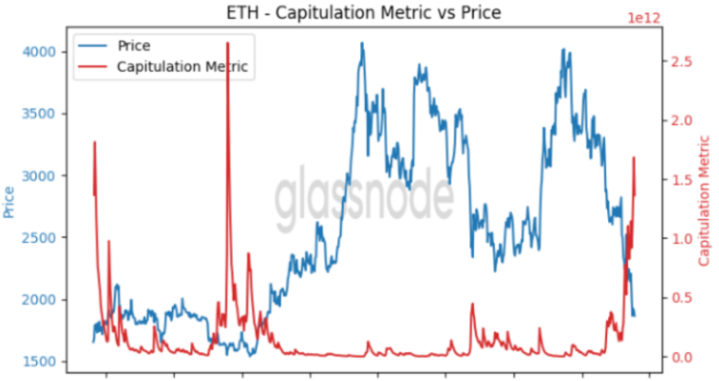
Glassnode’s Capitulation metric shows Ethereum holders in trouble. The Realized Loss Analysis and CBD indicator reveal extreme financial stress. Many are selling assets at lower prices.
Market bottoms in history have become evident from extreme selling periods. This forces weaker investors to sell their positions, thus creating accumulation opportunities for stronger participants.
Per Titan of Crypto’s post, ETH price was on the verge of emerging from its bear market phase, given the state of the market.
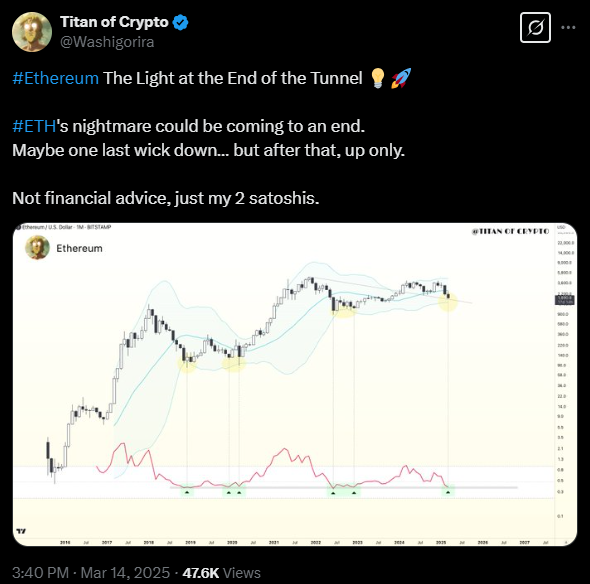
According to him, Ethereum reaches its lowest point in a month when it contacts the monthly minimum Bollinger band.
The market displayed this pattern thrice in 2019, 2020, and 2022, resulting in a major recovery. According to his analysis, ETH price should begin a recovery soon. On the other hand, he claimed that there is a slight chance of another market downturn.
Short Position Stack Up: Will a Short Squeeze Follow?
The short positions of Ethereum are a primary market driver because they hit historical peaks. The CFTC CME Ether Cash Settled Futures shows that short positions reached record highs during this period.
When the bearish market sentiment reaches excessively negative levels, it provides better conditions for a short squeeze.
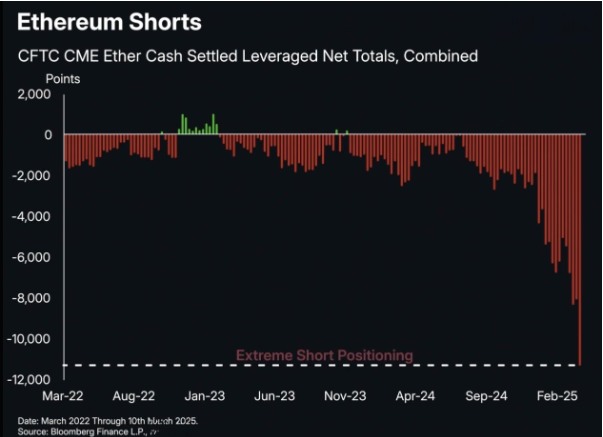
An unexpected price rise in the market produces a short squeeze. This forces sellers to settle their positions at higher costs, leading to a massive spike.
Ethereum Price Prediction: Where is ETH Heading Next?
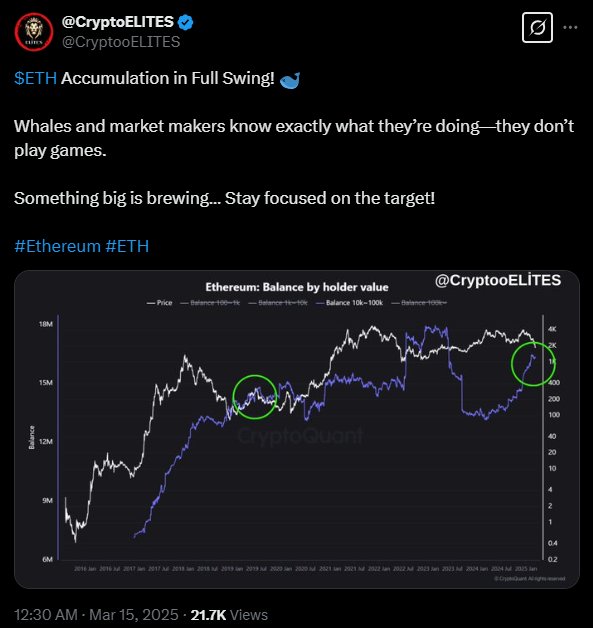
As Ethereum balance by holder value showed a massive upswing, it hints that something big is brewing in the market. After significant damage of over 28%, ETH price could gear up a massive recovery as whales have continued to accumulate.
Going forward, Ethereum price action hinted at a five-day consolidation price pattern around the $2000 mark. The Relative Strength Index (RSI) line stood at 35, hints at a reversal from the oversold conditions.
If sustained above the $2000 mark, ETH could target to cross the 20-day EMA mark for further short-covering moves. The immediate support zones were $1800 and $1650, whereas the resistance zones were $2100 and $2300.
Disclaimer
This article is for informational purposes only and provides no financial, investment, or other advice. The author or any people mentioned in this article are not responsible for any financial loss that may occur from investing in or trading. Please do your research before making any financial decisions.

