Key Highlights
- The SEC’s acceptance of a Bitwise Dogecoin ETF application has sparked bullish sentiment in the market.
- On March 11, DOGE reached a significant support level, showing resilience and potential for recovery.
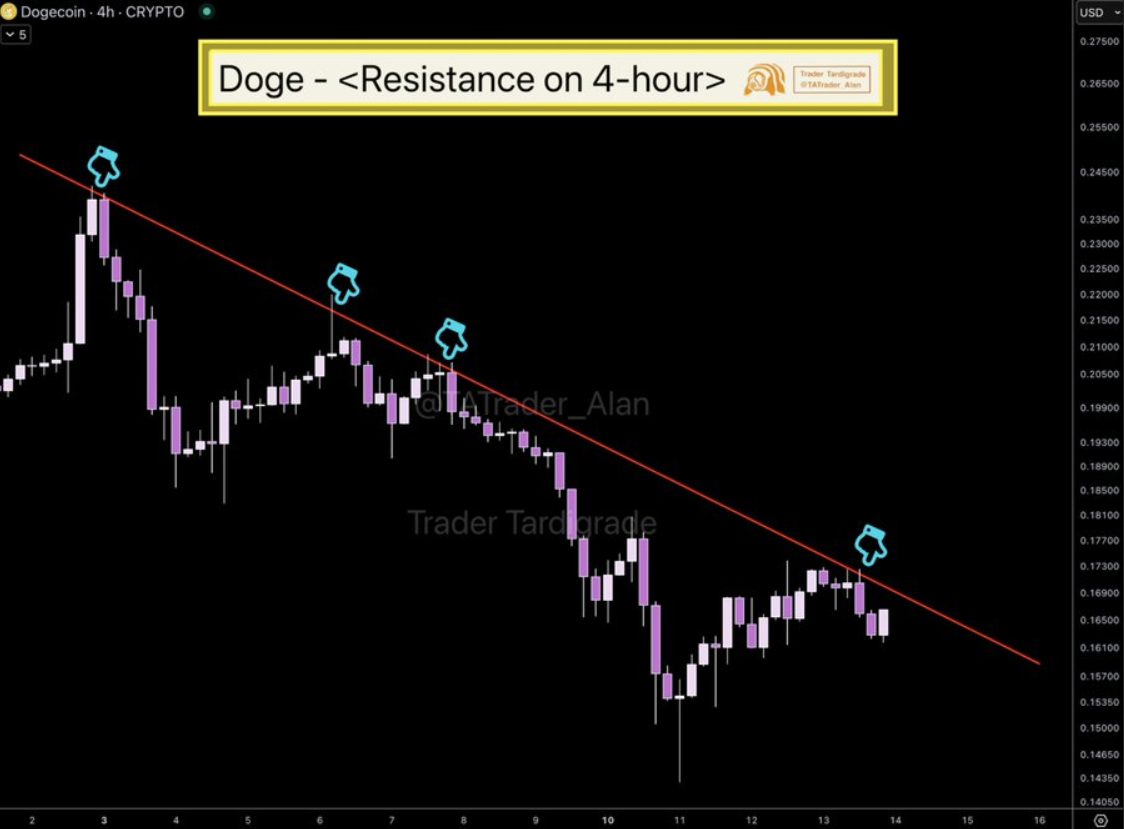
- Trader Tardigrade highlighted a crucial resistance trendline that DOGE must break to signal a reversal in the short term.
After reaching its yearly peak in December 2024, Dogecoin (DOGE) declined, following a downward dynamic trendline. This downward movement intensified in the first quarter of 2025.
It was influenced more by macroeconomic factors that suppressed positive developments in the market. This led to Dogecoin price falling, and the entire crypto sector suffered.
However, on March 11, after handling an intense fall, the token hit a historically significant support level at $0.1456. It is a point that had previously sparked a rally in November 2024.
In the days following this drop, the support level has shown signs of resilience, indicating potential for recovery.
This recent surge is linked to the SEC’s announcement that it has accepted a Bitwise Dogecoin ETF application. This news has sparked speculation about its possible impact on the price of the meme coin.

As a result, Dogecoin experienced a resurgence of bullish sentiment. It was fueled by broader market trends and encouraging technical signals.
The stabilization of the DOGE crypto market could be related to the broader rebound in the crypto sector. Bitcoin also recovered above $80K after falling to $77K.
Several market professionals share this optimism. Some predict a positive reversal, with a big increase in Dogecoin price.
Analyst Views Rally On Horizon In Dogecoin Price
Momentum trader Trader Tardigrade has identified a crucial resistance trendline on Dogecoin’s 4-hour price chart. He emphasizes that Dogecoin price must break above this trendline to reverse its decline. Multiple higher lows characterize it.


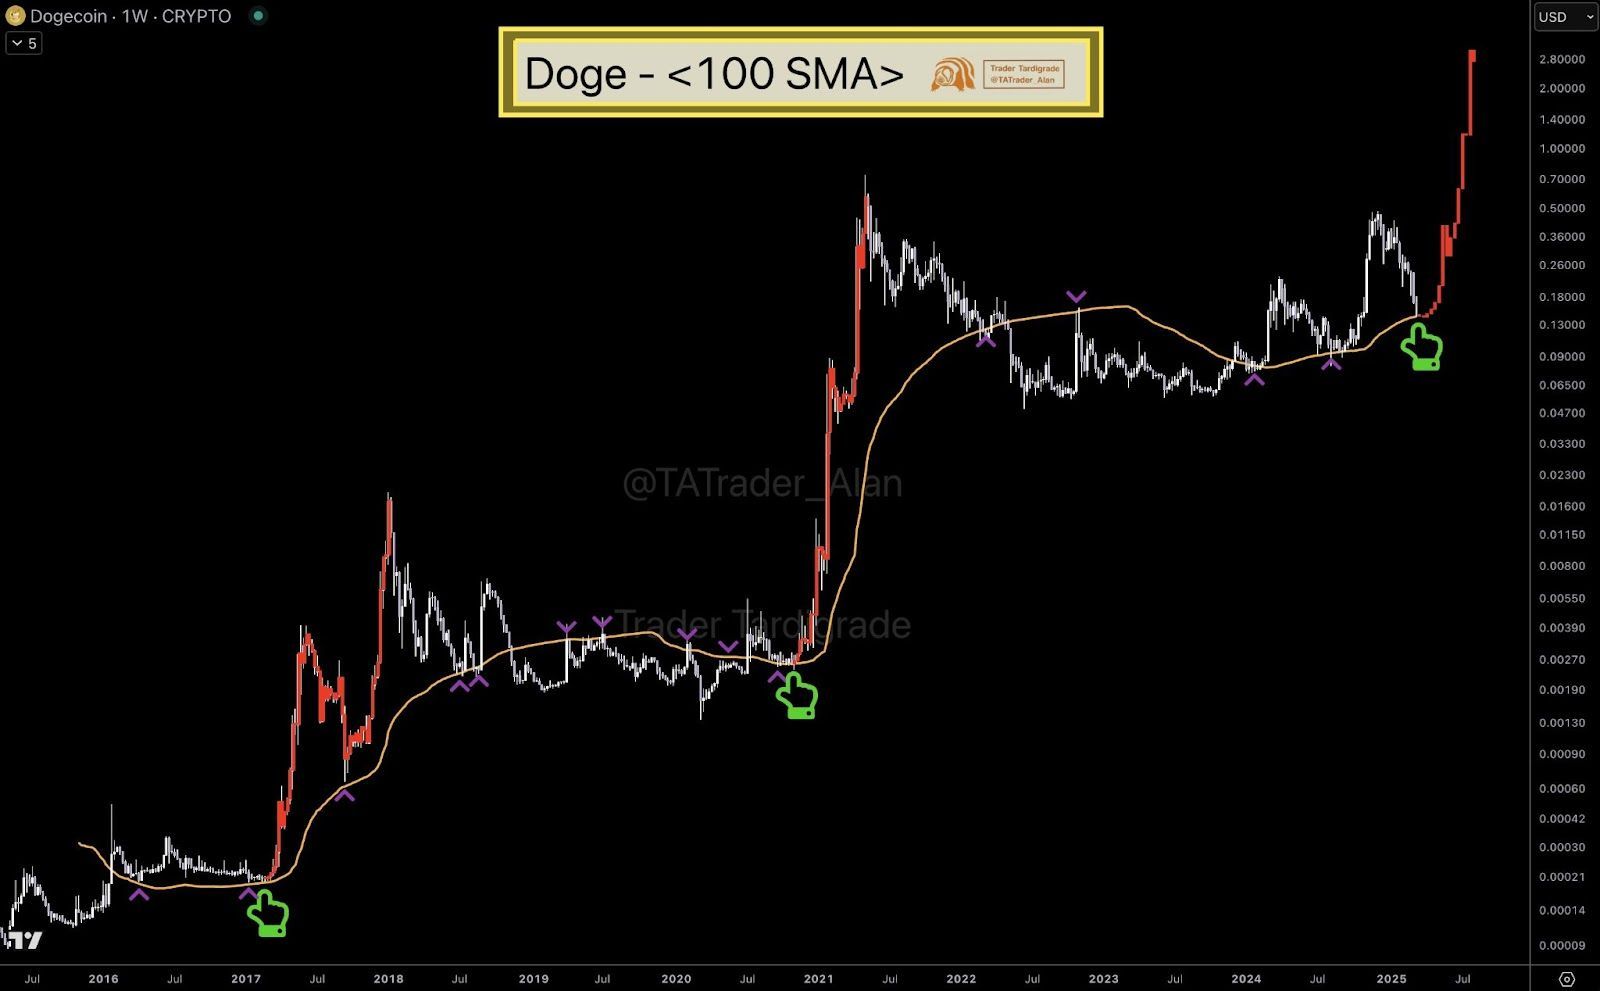
In his long-term analysis, Tardigrade has also highlighted the importance of the 100-week SMA in assessing the Dogecoin price trends. His findings suggest that DOGE has historically entered strong, bullish phases after breaking above this long-term resistance level.
The latest chart indicates that Dogecoin has again touched the 100-week SMA. It is a critical point that has triggered significant price movements. He explained that similar patterns have often marked the beginning of a bullish run during past bull cycles.

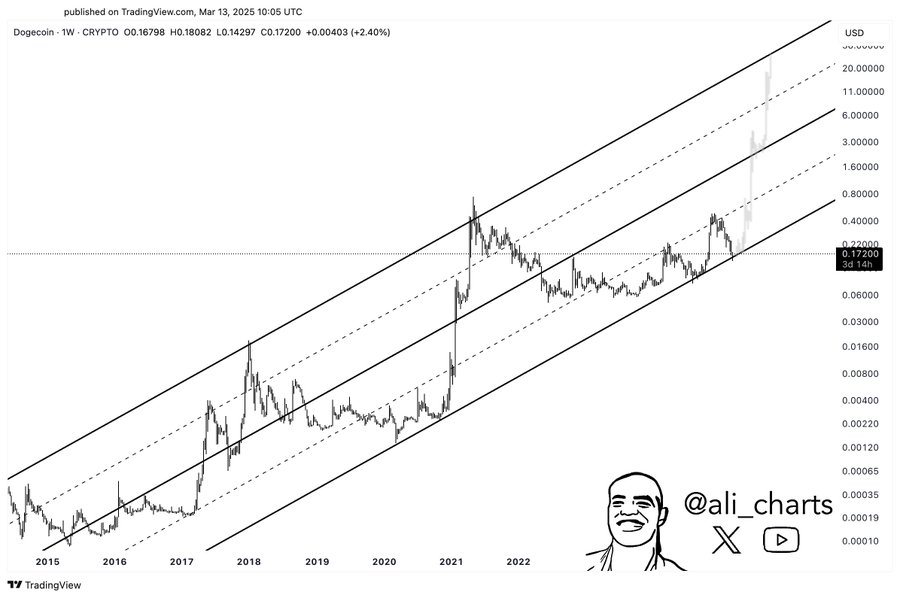
Similarly, another analyst, Ali, shared his chart analysis on X. This showcased an ascending parallel channel in the long-term outlook for DOGE crypto.
He attributes this positive trend to rising network activity. This shows increased on-chain movement compared to previous periods of limited activity. As a result, Ali has set a long-term target for Dogecoin that exceeds $20.

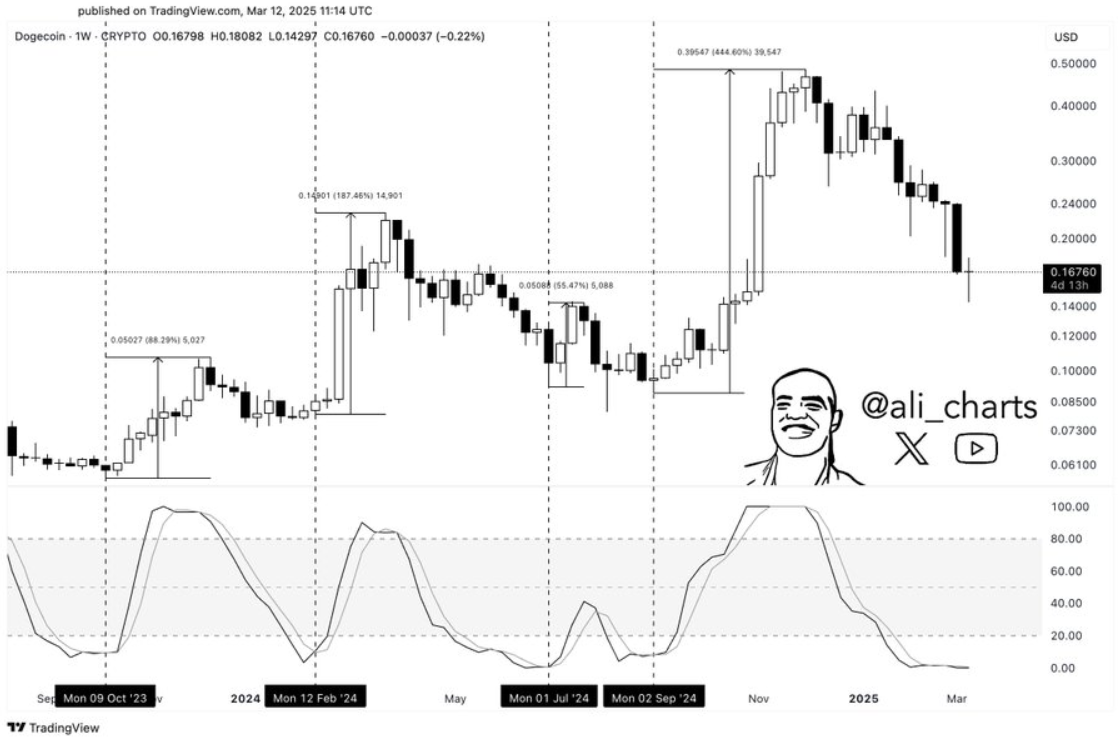
A few days ago, Ali mentioned one of his favorite technical indications, highlighting a shift in momentum. According to him, Dogecoin’s Stochastic Relative Strength Index (Stoch RSI) is nearing a bullish crossover. It is a pattern often associated with impending price rebounds.
Disclaimer
In this article, the views and opinions stated by the author or any people named are for informational purposes only, and they don’t establish the investment, financial, or any other advice. Trading or investing in cryptocurrency assets comes with a risk of financial loss.

