Key Insights
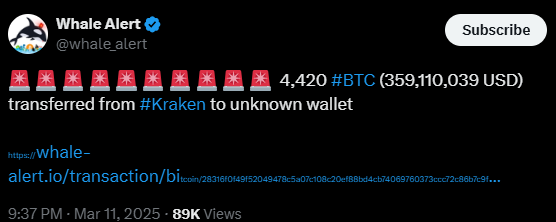
- 4,420 BTC ($359M) moved off Kraken, signaling whale accumulation and reduced selling pressure.
- Bitcoin’s double bottom pattern near $70K-$76K suggests a potential rebound if it breaks the $85K-$87K resistance.
Bitcoin (BTC) price demonstrated volatile swings. This happened after the Kraken exchange experienced a large withdrawal while traders observed essential support zones.
The recent market shift caused analysts to hypothesize about an upcoming price recovery. On the other hand, they identified a potential double-bottom pattern between $70,000 and $76,000.
Technical analysts indicate a price breakout could aim for $90,000–$100,000. At press time, Bitcoin price was trading at $82877 with an intraday rise of over 2.11%. Its market cap stood at $1.64 Trillion and has a total supply of 19.83 Million.
Whale Movements Indicate Strong Potential for Long-Term BTC Price Appreciation
Whale Alert data revealed that an unknown wallet acquired 4420 BTC from the Kraken exchange. It totaled $359 Million in Bitcoin payments. Transferring significant Bitcoin amounts to unknown wallets reveals evidence of major holders’ accumulation.
Likewise, in the past few hours, another unknown wallet received 4777 BTC worth $394 Million BTC through the Kraken exchange.
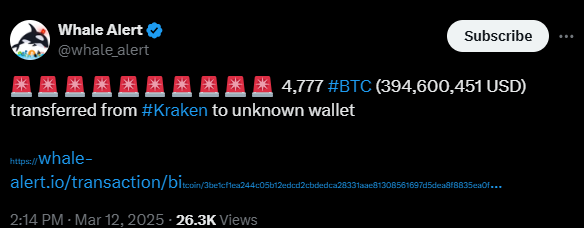
These significant whale withdrawal activities highlighted the belief that BTC price maintains a strong potential for long-term value appreciation.
Bitcoin Forms Double Bottom Pattern: Is a Rebound Ahead?
A recent post on X by Crypto Fella highlighted that Bitcoin price has made a double bottom pattern on the 4-hour chart. It has maintained a strong support of around $76K and made double bottom formation. This usually led to an upcoming reversal.
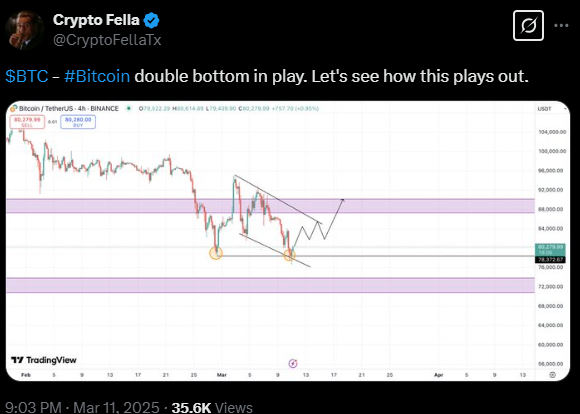
The double bottom pattern is considered bullish. However, the confirmation requires BTC price to break above $85,000–$87,000, a key resistance zone.
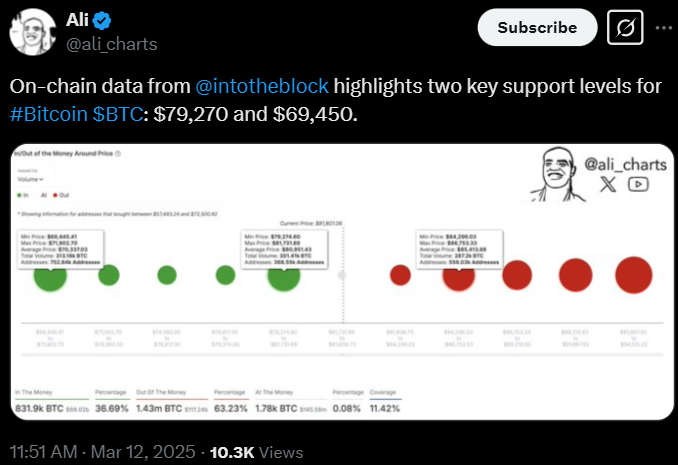
Successful price resistance at this level provides evidence that Bitcoin might start its upward move toward its next target range. According to IntotheBlock data, the token has significant support levels of $79.270 and $69,450, as stated in Ali Charts’ report.
Moreover, another evidence of the upcoming reversal was shared by analyst Merlijn. According to the analyst, the daily analysis of Bitcoin price chart revealed a bullish divergence. This further hinted at a major rally ahead.
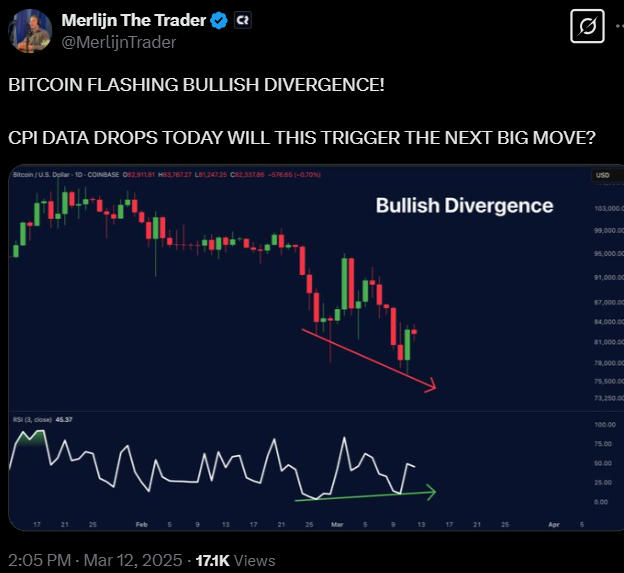
The upcoming CPI data drop might fuel a short-covering move. This could pave the way toward $90K in the following sessions.
The Relative Strength Index (RSI) line recouped from the oversold region, and a positive crossover was noted on the chart. A significant bear trap movement could be seen if BTC price moved past the 200-day EMA zone of $86K.
Futures Market Data Outlook
The liquidation heatmap data from Coinglass indicated that massive liquidations happened around $80k.
However, Bitcoin price may stay above the $82K zone. Significant short covering could be anticipated as $37.10M worth of short positions around the $81K strike price.
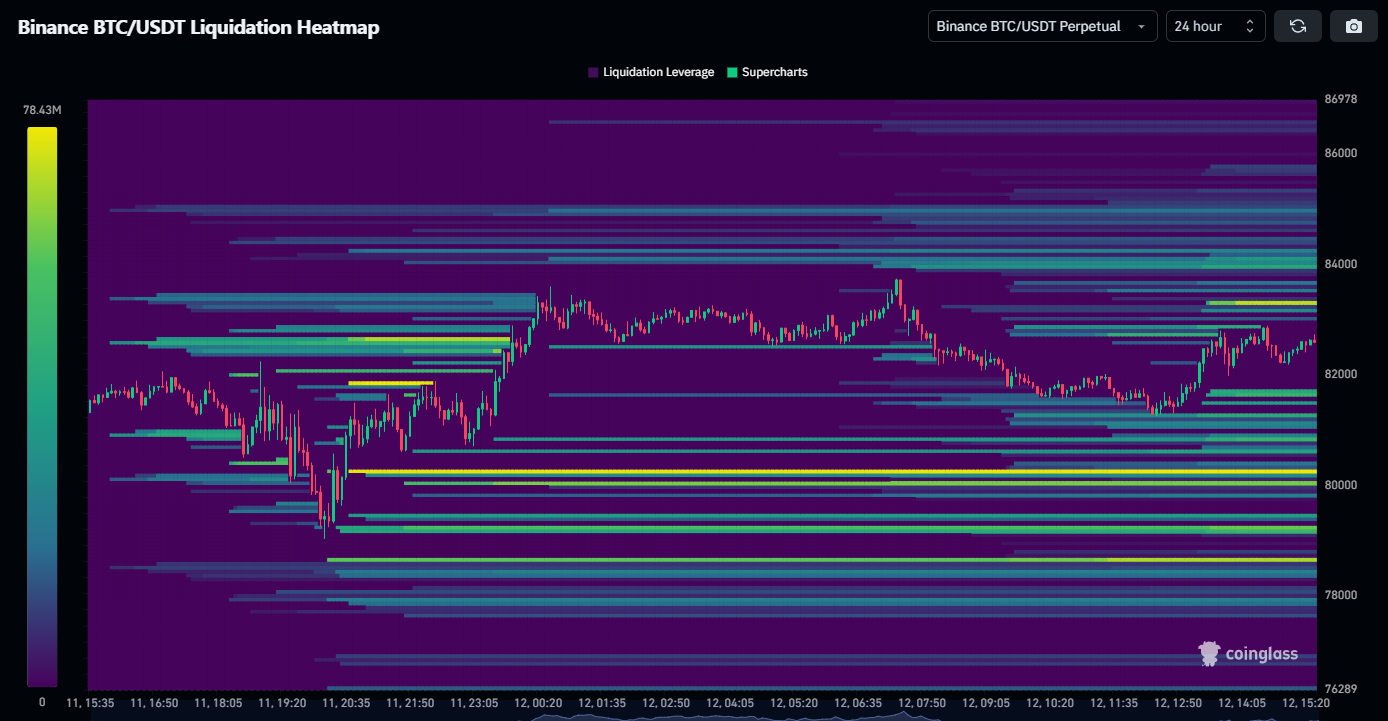
In the past 24 hours, the Open Interest (OI) has surged over 0.43% to $46.77 Billion. This further revealed long buildup activity in the past 24 hours. The OI-weighted funding rate stayed positive at 0.0056% highlighting significant demand for the long contracts.
Disclaimer
In this article, the views and opinions stated by the author or any people named are for informational purposes only, and they don’t establish the investment, financial, or any other advice. Trading or investing in cryptocurrency assets comes with a risk of financial loss.

