Key Insights
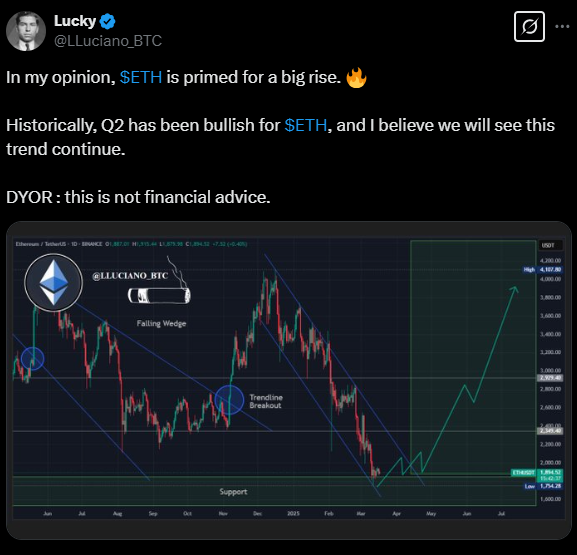
- Ethereum has historically performed well in Q2, with consistent price gains from 2016 to 2021.
- Analysts predict a breakout as ETH forms a bullish falling wedge pattern.
- If ETH follows past trends, it could rally toward $3,500 or higher in Q2 2025.
Ethereum price is approaching the second quarter of 2025, showing historical strength for the asset. Historical price analysis hints that ETH might undergo a breakout since the current price action matches previous bullish market periods.
At press time, ETH price was trading at $1891, noting a decline of over 0.90% in the past 24 hours. Its market cap stood at $228.58 Billion, and the total supply stood at 120.62M.
Ethereum Price Q2 Prospects: Will the Market Turn Bullish?
From 2016 to 2021, the second quarter delivered positive returns for ETH as prices rose. Ethereum price experienced a moderate price decline in Q2 2022. However, the asset has historically demonstrated strong performance during the second quarter.
Projections for Q2 2025 suggest that ETH price could reach a critical resistance level of $3,500 or higher. Favorable market conditions and potential bullish momentum could drive it.

According to market analyst @LLuciano_BTC, Ethereum price will likely move upwards based on previous market trends. Per him, the positive market trends from Q2 of previous years will repeat during this next quarter.
Are Whales Gearing Up for a Massive Shift?
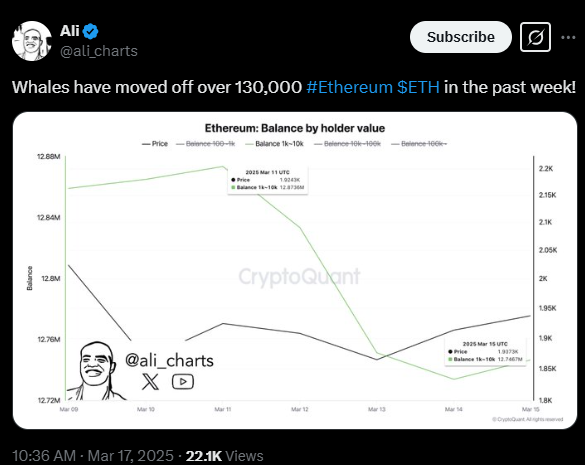
A recent post by Ted revealed that large investors or whales were betting big on Ethereum and rotating profits into it.

It could be a sign of confidence in Ethereum’s long-term potential. Maybe they know something we don’t, or it’s just a smart diversification play. Either way, it’s worth keeping an eye on.

Large holders reduced their balances by over 130k ETH in just a week. Despite this, ETH price held gains around the $1900 mark.
The significant decline in holder balances has sparked speculation about its implications. Some suggest it could be an early indicator of market instability, while others view it as a routine position shift.
ETH Price Prediction: What Do Technical Indicators Say?
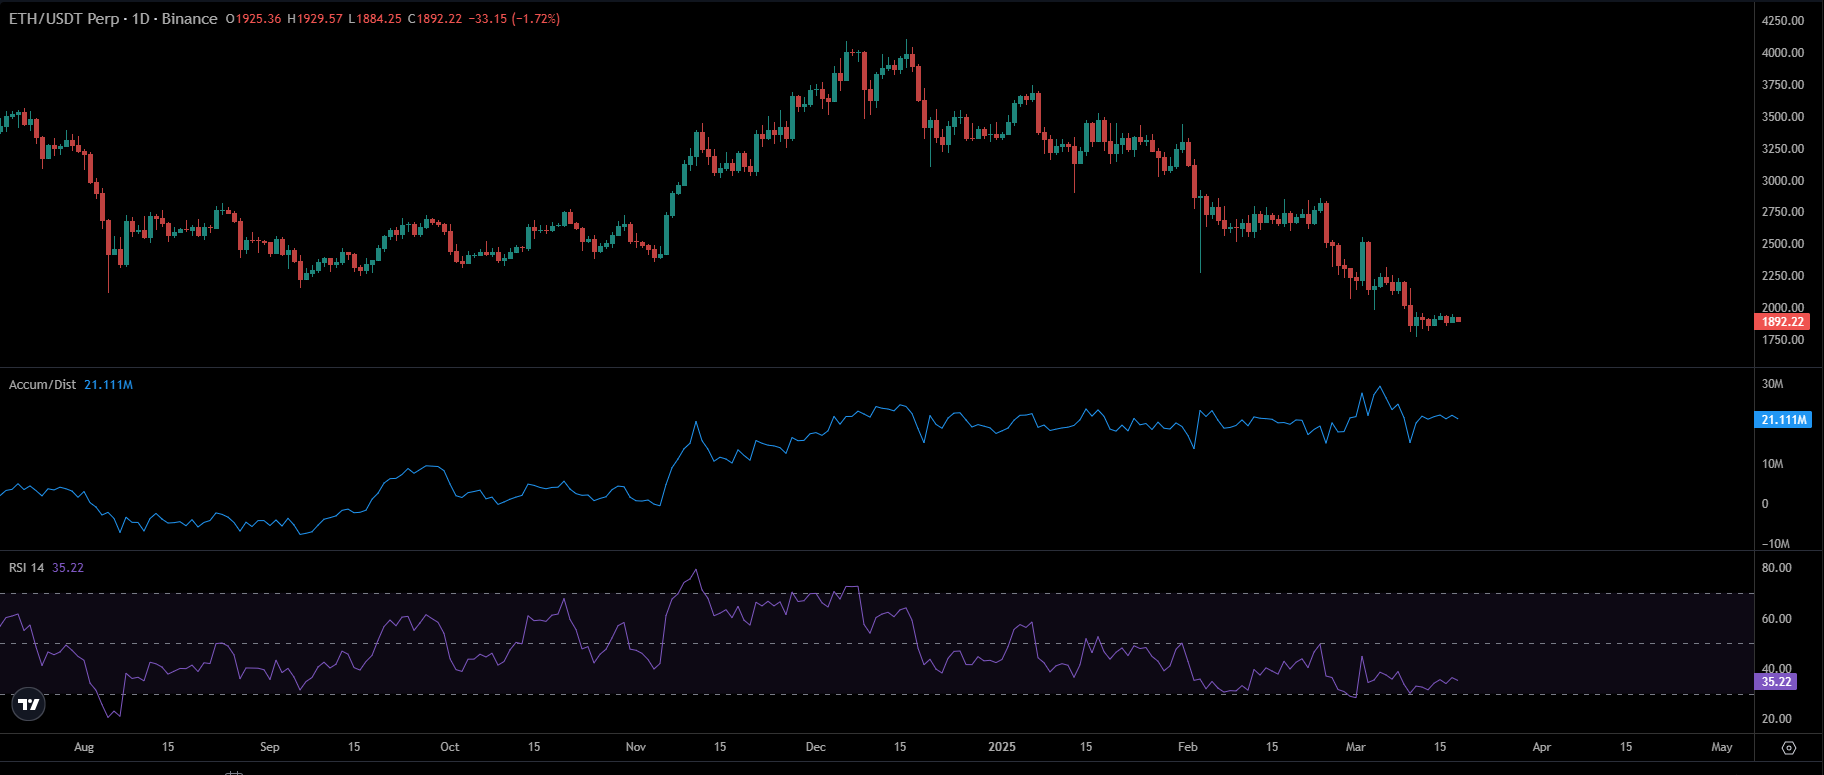
Ethereum price has hovered below the $2000 hurdle and remained sideways in the past seven days. Amidst a rebound from the $1700 mark, ETH price still didn’t retest the 20-day EMA mark. Moving ahead, it stagnated around the 38.2% Fib support zone.

However, the Accumulation/Distribution (A/D) metric showcased a minor increase. This highlighted that buyers have been stepping in, which could trigger a price shift ahead.
The Relative Strength Index (RSI) line was 35, unveiling the oversold readings. It suggested that sellers had grabbed their upper hand and did not permit the bulls to overtake the $2000 hurdle. That resulted in price consolidation.
Data from Coinglass showed that Open Interest (OI) has surged over 0.72% to $17.96 Billion. This reflected a prolonged buildup activity in the past 24 hours.
Traders should watch key resistance levels of $2100 and $2250 and broader market sentiment to gauge Ethereum’s next move. If sellers breach the immediate cluster of $1800, Ethereum price may slip toward the next $1600 and $1450 support zone.
Disclaimer
In this article, the views and opinions stated by the author or any people named are for informational purposes only, and they don’t establish the investment, financial, or any other advice. Trading or investing in cryptocurrency assets comes with a risk of financial loss.

